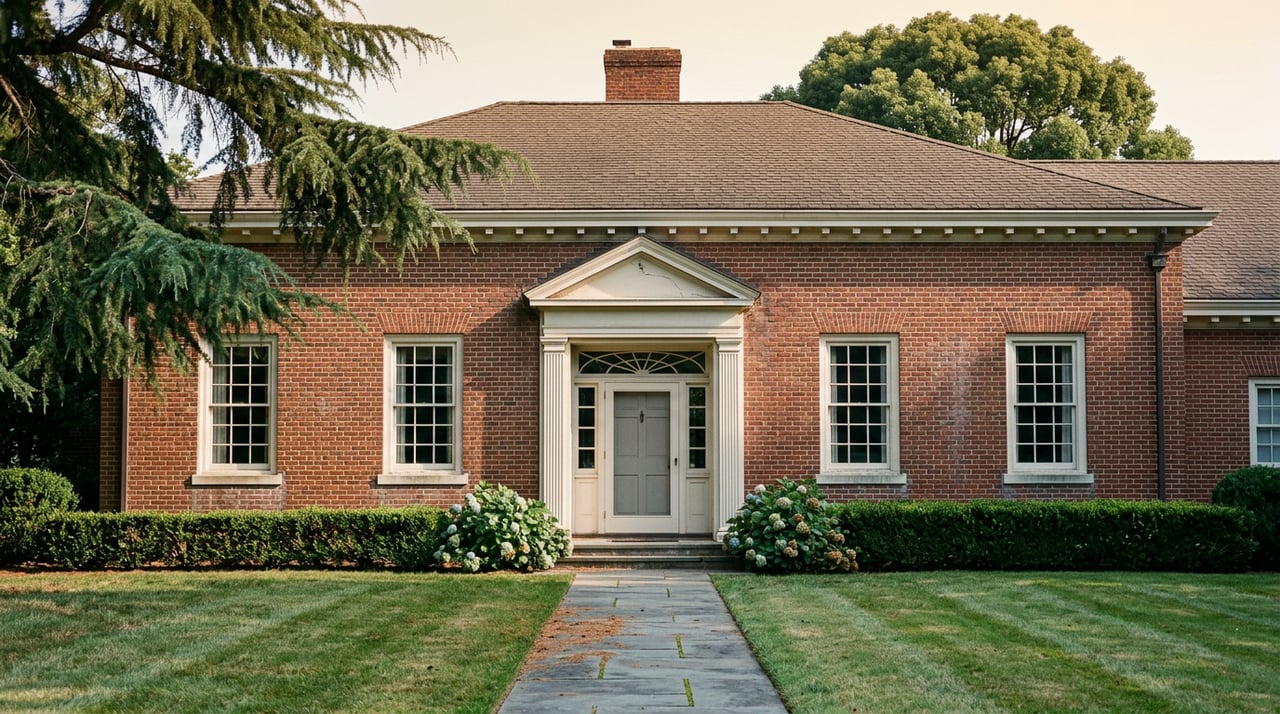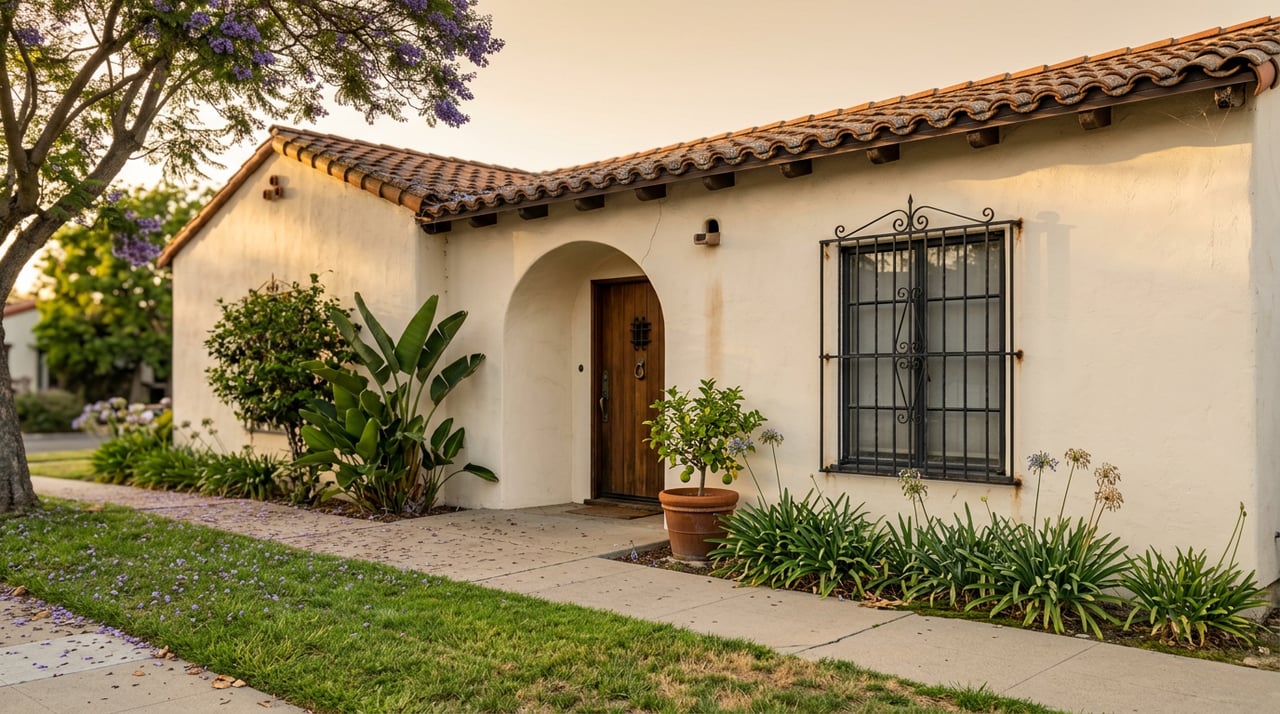
Two numbers came out of the same small Mid City neighborhood within a few months of each other, and they don't agree. In November 2025, the median sale price in Picfair Village rose 5.1% year over year to $1.4 million. By March 2026, the median had reversed course, down 6.9% year over year to $1,305,000. Meanwhile, the price per square foot never wavered from its climb: up 31.5% year over year as of that same November snapshot, landing at $955 a foot.
A median that swings and a per-foot price that only goes up are not two views of the same trend. They're evidence of two different markets operating under one neighborhood name. If you're shopping Picfair Village right now, understanding why matters more than memorizing either number.
The Numbers, Side by Side
Picfair Village is a small neighborhood by transaction volume. Nine homes sold in November 2025, up from six the year before. That's a sample size where one estate sale or one land deal can swing the median by six figures. Small samples explain volatility, but they don't explain a 31.5% jump in price per square foot holding steady across the same window.
| Metric | Period | Figure |
|---|---|---|
| Median sale price | Nov 2025 | $1.4M (+5.1% YoY) |
| Median price per sq ft | Nov 2025 | $955 (+31.5% YoY) |
| Median sale price | March 2026 | $1,305,000 (-6.9% YoY) |
| Days on market | Nov 2025 | 50 (down from 61) |
| Homes sold | Nov 2025 | 9 (up from 6) |
Homes are also selling faster, down to 50 days on market from 61 a year earlier. Faster sales alongside a rising per-foot price usually points to demand concentrating on a specific type of property rather than demand rising evenly across the whole neighborhood. That's the thread worth pulling.
A Village Split Down the Middle, Literally
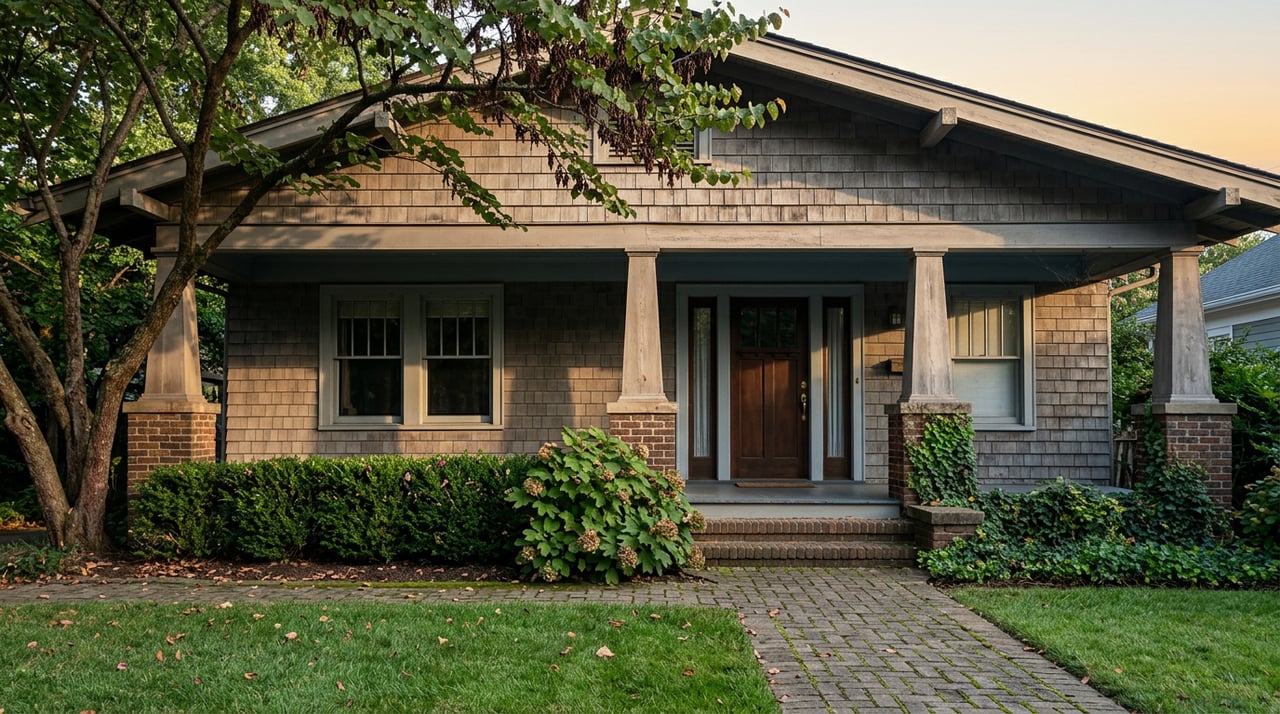
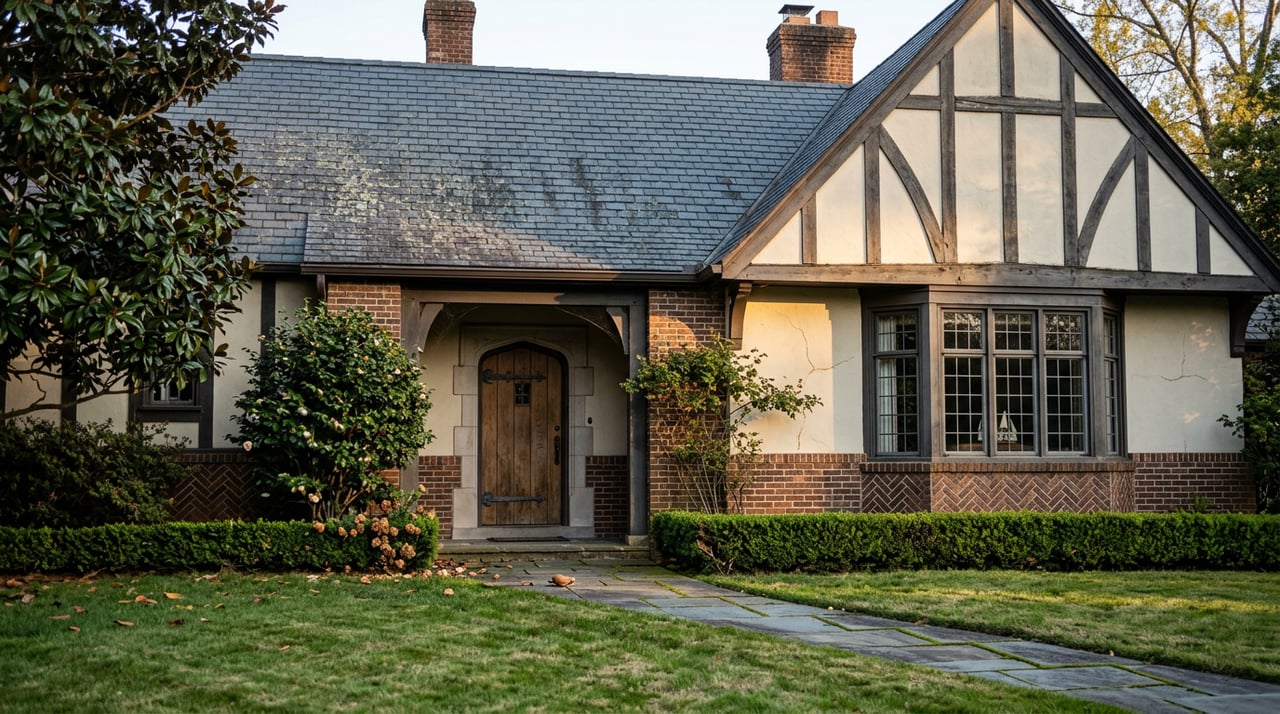
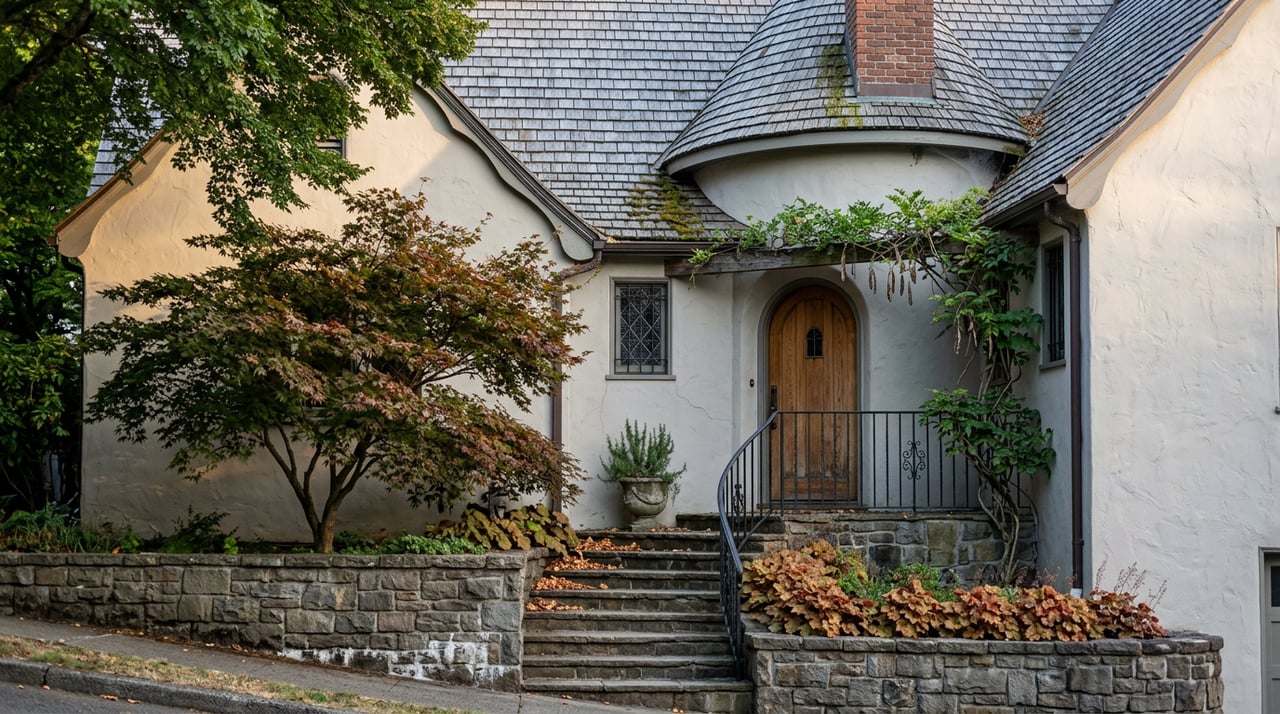
Picfair Village runs from Pico Boulevard on the north to Venice Boulevard on the south, bounded by Fairfax Avenue to the west and Hauser Boulevard to the east. Within that small footprint, the zoning isn't uniform. The Picfair Village Neighborhood Association describes a housing stock that is predominantly Spanish Colonial and Art Deco, built mostly in the 1920s and 1930s, sitting on land zoned both R-1 and R-2 under the Los Angeles zoning code.
That zoning split isn't evenly distributed. Multi-unit dwellings cluster north of Saturn Street, while the area south of Pickford Street runs almost entirely single-family. The lot shapes follow the street grid: homes on the north-south streets tend to sit on full-size 5,000 to 6,000 square foot lots, while homes on the east-west streets tend to be on smaller, bungalow-sized parcels. Two houses a block apart can carry different zoning, different lot economics, and different buyer pools entirely, even though both would show up in the same neighborhood-level comp report.
For context on scale, Picfair Village holds roughly 678 total residences, with home sizes ranging from 534 to 3,409 square feet and an overall average around 1,496 square feet. That's a tight enough inventory that a handful of R-2 land sales can meaningfully bend the median without touching what a renovated single-family home on an R-1 block is actually worth per foot.
Two Kinds of Buyers, One Zip Code
Here's where the two numbers stop arguing and start making sense together. The single-family, R-1 stock south of Pickford is what's driving the price-per-square-foot number upward. These are the fully renovated Spanish and Art Deco homes buyers are shopping for design, and they're pricing them the way design buyers price things: by the finished square foot, not by the lot.
The R-2 stock north of Saturn Street is a different transaction entirely. One active land listing in the neighborhood right now offers a vacant parcel with completed architectural, structural, and landscape plans for a 5-story, 20-unit apartment building with subterranean parking. The listing markets the site's five years of vacancy as a point in its favor under the state's SB 8 housing rules, the kind of detail that only matters to a builder, not a homeowner. That's not a home buyer's transaction. It's an investor pricing dirt and entitlement, not finished living space, and it settles into the sales data as a data point with no meaningful price-per-square-foot at all.
When a neighborhood contains both kinds of sales in the same small pool, the median absorbs whichever type happened to close that month, while the price-per-square-foot metric, which only makes sense for finished residential product, keeps climbing on the strength of the renovated homes alone. That's the mechanism behind the disagreement. It isn't noise. It's two markets sharing one address.
What This Means If You're Actually Shopping Here
If you're comparing Picfair Village to nearby pockets like Faircrest Heights to the west, or Wilshire Vista and Miracle Mile just to the north, resist the urge to lean on the neighborhood median as your benchmark. It won't tell you what a specific block is worth. Instead:
- Ask whether the property sits north or south of Saturn Street and Pickford Street before comparing it to a comp on the other side.
- Check the parcel's zoning designation before assuming a lower per-foot price is a deal. On an R-2 lot, a lower price can simply mean you're paying for land value the seller expects a future buyer to build on, not a bargain on the house itself.
- If you're buying a fully renovated home south of Pickford, expect to compete on the per-square-foot number, since that's the metric other design-focused buyers in this pocket are using to judge value.
- If you're the seller of an R-2 parcel, especially one that's sat vacant, understand that your buyer pool is builders and small multi-family investors, not homeowners, and price accordingly.
None of this shows up cleanly on a portal search. It shows up when someone pulls the zoning map next to the sale price and asks why two homes on the same street sold so differently. That's the kind of comparison worth having before you write an offer, not after.
Frequently Asked Questions
Does a lower price per square foot always mean a better deal in Picfair Village? Not necessarily. A lower number can reflect an R-2 parcel priced for its development potential rather than its current livable space, which is a very different calculation than comparing two finished homes.
How do I find out if a specific lot is zoned R-1 or R-2? Zoning is public record and searchable through the city's ZIMAS mapping tool, but confirming it against the current Los Angeles zoning code and cross-checking it with recent comparable sales is worth doing before you set an offer price.
Is the area north of Saturn Street a good fit for someone who just wants a single-family home? It can be, but expect more multi-unit properties and land listings in the mix there than south of Pickford, where the single-family stock is more concentrated.
If you're weighing Picfair Village against its neighbors or trying to figure out what a specific block is actually worth before you make an offer, that's a conversation better had with someone who tracks these blocks by name. Ali Jack works across central and east Los Angeles with exactly this kind of block-level detail in mind. Let's Connect before you rely on a neighborhood-wide median to make a very specific decision.