Pull up two different pages on the same real estate portal for Windsor Square and you get two different neighborhoods. One page, current as of March 2026, shows the median sale price at $888,000, down 70.9 percent from a year earlier. A second page on the same site, its rolling calculation still anchored to a month from February 2025, shows a median of $3.6 million, up 62.4 percent, built from a stretch where five homes sold, up from four the year before. Both numbers come from the same data provider, describing the same eleven hundred or so homes between Larchmont Boulevard and Wilshire Country Club. Neither page has caught up with the other, because there simply aren't enough closings coming through to force them into agreement.
Neither number is wrong. That's the problem.
Windsor Square doesn't trade like a normal housing market. It trades like a small, illiquid stock. When only a handful of transactions close in any given stretch, the "median" stops describing a market and starts describing whichever specific houses happened to sell. If a $4 million Tudor and a $900,000 fixer close in the same window, you get a headline that looks like a crash. If two $5 million estates close instead, you get a headline that looks like a boom. Nothing about the underlying market moved. The sample just changed.
Why the sample is so small in the first place
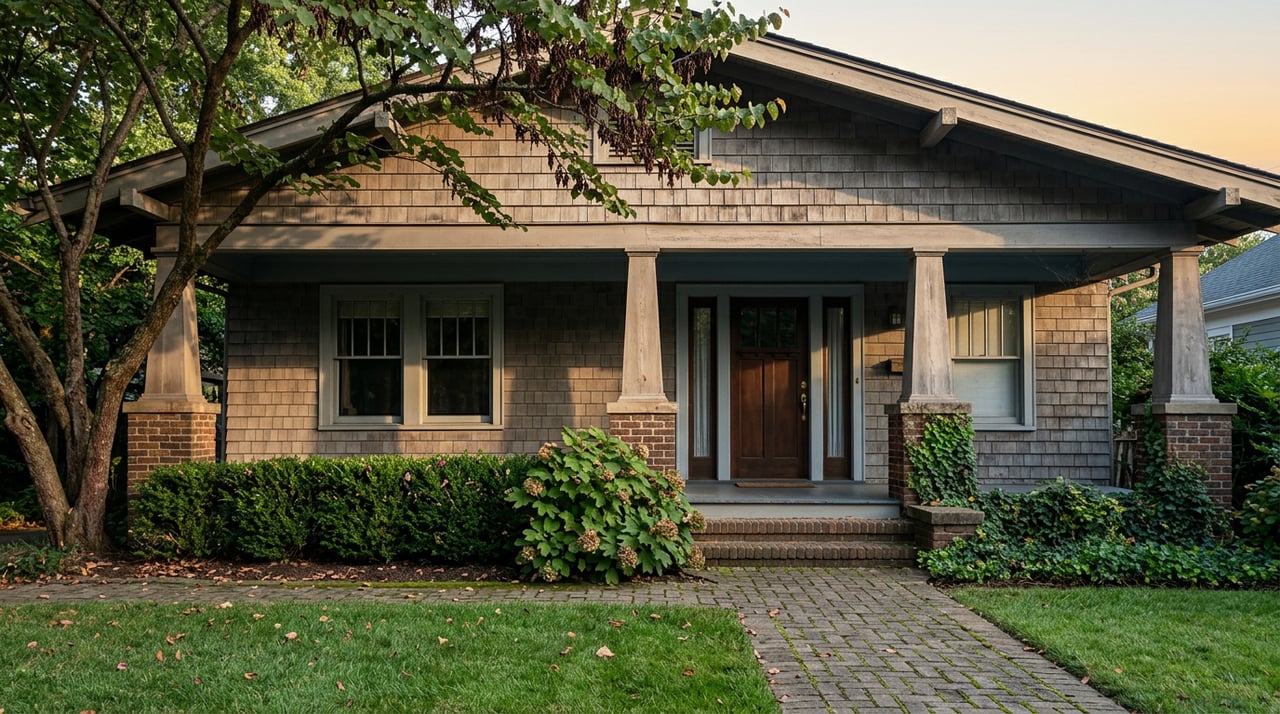
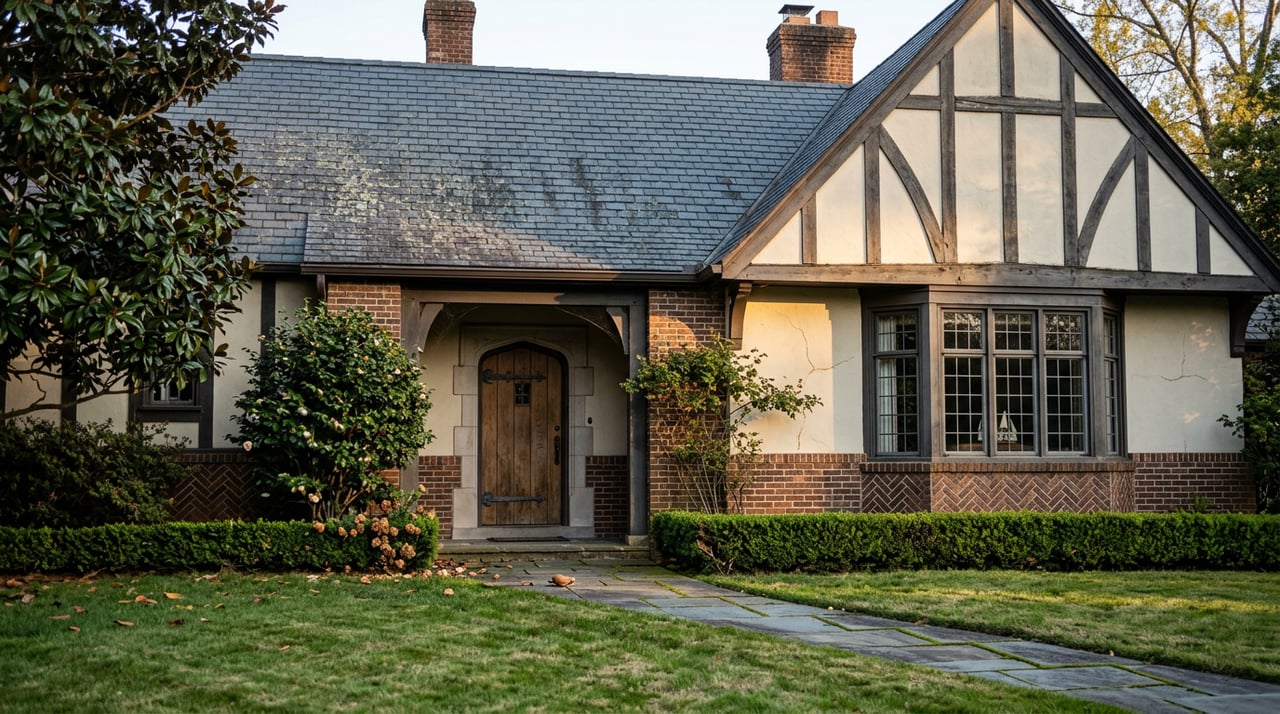
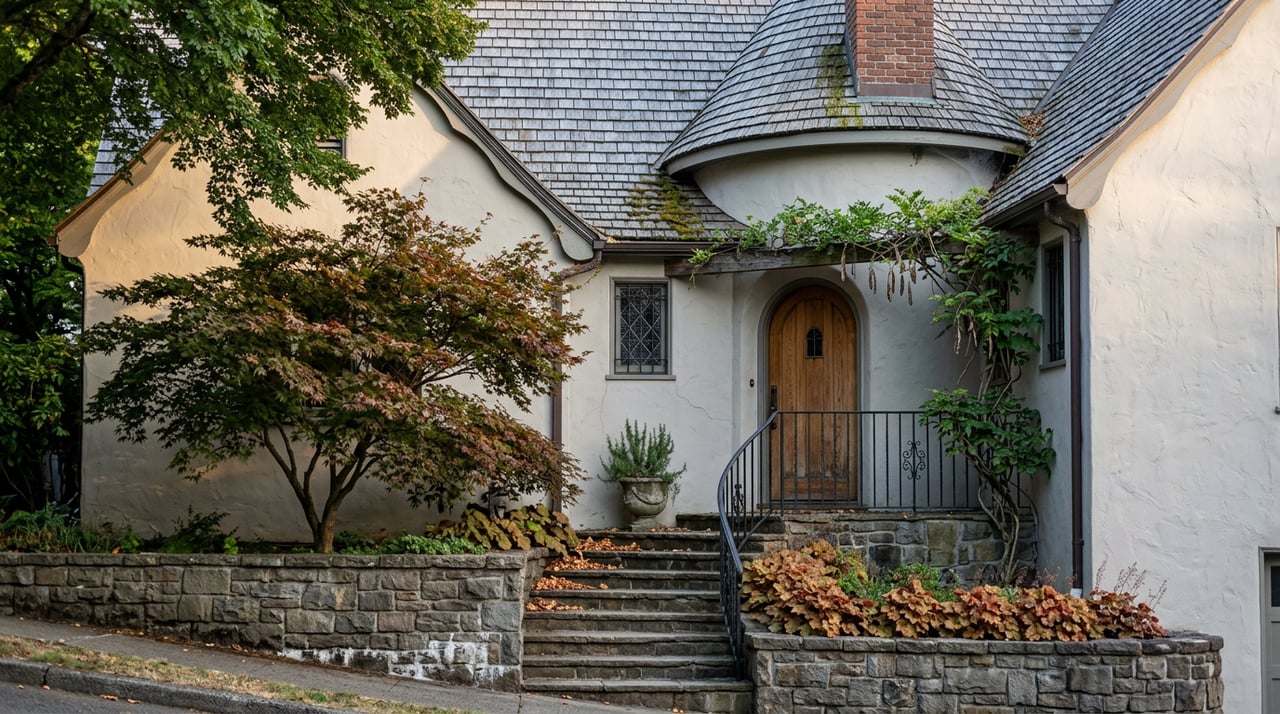
Windsor Square became a Historic Preservation Overlay Zone in 2005. The Windsor Square Association notes that nearly 90 percent of the roughly 1,100 homes in the neighborhood still carry their original street-facing facades from the early 1920s. That's the preservation plan working as intended, and it's also the reason the inventory pipeline never really opens up. New construction is rare by design. Teardowns are rare by design. The homes that exist are largely the same homes that existed a century ago, owned by families who tend to stay for decades rather than years.
That's a very different supply picture from a neighborhood where builders can add spec homes or knock down and rebuild to meet demand. In a market like that, a slow month gets absorbed by next month's new listings. In Windsor Square, there's no such cushion. The number of homes that could theoretically sell in any quarter is capped by how many owners decide, in that specific window, that this is the year.
The first quarter of 2026 shows exactly how tight that cap can get.
| HPOZ Sub-Area | Homes Sold, Q1 2026 | Average Sale Price | Average Days on Market |
|---|---|---|---|
| Windsor Square HPOZ | 2 | $4,902,500 | 10 |
| Hancock Park HPOZ | 5 | $5,360,500 | 29 |
| Larchmont Village | 4 | $1,978,000 | 34 |
| Fremont Place | 0 | — | — |
| Brookside | 0 | — | — |
Two closings in Windsor Square across an entire quarter. Zero in Fremont Place. Zero in Brookside. This isn't a downturn. It's what a preservation-zoned enclave of large, generational homes looks like in a normal three-month stretch. The average sale price of $4,902,500 in Windsor Square that quarter is real, but it's an average of exactly two houses, on an average lot of 11,654 square feet. Swap either house out and the number moves by hundreds of thousands of dollars without the market itself doing anything.
March had zero. June looked completely different.
The volatility shows up month to month, too. In March 2026, closing records for the neighborhood cluster showed just two closings in Hancock Park HPOZ and none at all in Windsor Square HPOZ, Fremont Place, or Brookside that month. The one notable close nearby was 258 S Hudson Ave, a move-in-ready single-level home on the Wilshire Country Club golf course, which sold for $5.27 million, or $1,324 per square foot, in 11 days.
By June 2026, the picture had shifted again. Eleven sales closed in Hancock Park that month, roughly matching the pace from a year earlier. The top sale was 531 S Rossmore, which closed at $7.15 million after starting at $8.995 million and sitting on the market for 105 days. The fastest sale was 217 S Hudson, on the market for the first time in 50 years, which closed at $7 million in 26 days after listing at $7.5 million. A third property, 134 N McCadden, closed at $6.6 million after 56 days. That house had been bought by a developer five years earlier for just over $3 million, then renovated with an ADU and a pool before resale.
None of those three are Windsor Square addresses. They're Hancock Park, its immediate HPOZ neighbor, and I'm naming them because they illustrate the same mechanism at a scale where you can actually see the texture. A house that sits 105 days and closes $1.8 million under its original ask tells a different story than a house that moves in 26 days at nearly full price, even though both cleared well above $6 million. If you flatten that into one median for the month, you lose the story entirely. That's what happens to Windsor Square every single month, just with an even smaller sample to average over.
A separate portal's March 2026 figure for Windsor Square put the median home price at $2,900,000, with a trailing 12-month median of $3,092,500, up 14 percent year over year. That's a third distinct number from a third source, covering yet another window. None of the three portals agree, because none of them are actually disagreeing about the market. They're disagreeing about which two or three houses landed in their sample that month.
What this means if you're comparing neighborhoods
If you're weighing Windsor Square against Hancock Park, Larchmont Village, or Fremont Place, the headline median on any single site is close to useless as a comparison tool. Here's what actually tells you something:
- Price per square foot across a rolling window, not a single month. A single month's $711 per square foot or $1,324 per square foot can be one house's finish quality, not a market rate.
- Days on market trend, not the average alone. Ten days average sounds fast until you realize it's the average of exactly two sales. Twenty-nine or 34 days, drawn from four or five sales, is a steadier read.
- What actually closed, by address, lot size, and condition. A 4,621-square-foot house on an 11,654-square-foot lot is not the same product as a 2,217-square-foot house on a 6,114-square-foot lot, even if they're three blocks apart. Averaging them together and calling it "the market" flattens two very different products into one meaningless number.
- Whether the sample includes zero months. If a portal's year-over-year comparison spans a month with zero sales against a month with two or three, the percentage change is mathematically real and practically meaningless.
A single median in a neighborhood this small isn't a market signal. It's a photograph of whoever happened to close escrow that month. The market only shows up once you stack enough of those photographs together to see the pattern underneath.
This is the same reasoning that applies whether you're comparing Windsor Square to its immediate neighbor Hancock Park, or weighing the more commercially active corridor of Larchmont Village against the quieter, even lower-volume streets of Brookside. Each of these pockets carries its own preservation rules, lot sizes, and closing pace, and each one will occasionally hand you a monthly statistic that looks dramatic and means almost nothing on its own.
Frequently Asked Questions
How many homes typically sell in Windsor Square each month? Based on the first quarter of 2026, the pace runs close to one home a month on average, with entire months recording zero closings. A single quarter with two sales is not unusual for this neighborhood.
Is Windsor Square's median price rising or falling in 2026? Depending on which snapshot you use, the answer is both. That contradiction is itself the point. The honest answer is that with so few transactions, the direction of "the median" tells you more about sample size than about demand.
Why do different real estate sites show different numbers for the same neighborhood? Each site pulls its window and calculation slightly differently, and in a market this thin, even a one-house difference in the sample can swing the headline by double digits in either direction.
If you're trying to make sense of what a specific Windsor Square, Hancock Park, or Larchmont Village property is actually worth, the median on a portal page won't get you there. Comparable sales, read house by house, will. Ali Jack has spent more than a decade tracking exactly these blocks, and can walk you through what the real comps say about a specific home, whether you're buying or getting ready to sell. Let's Connect.